Salem-Keizer Q1-3 2026: What Duplexes Actually Sold For
TL;DR
What did duplexes actually sell for in Salem-Keizer in Q3 2026? Small multifamily deals are closing with seller paid concessions, rate buydowns, and extended timelines rather than substantial price cuts, as 7.5-8 percent investment loan rates squeeze buyer offers against Oregon's 9.5 percent rent cap. Real closing prices per unit vary by submarket and condition; pull verified closed sales from verified WVMLS data instead of asking prices from aggregator sites.
- Investment property financing is running 7.5-8 percent, forcing buyers to restructure terms (seller financing, rate buydowns, longer closes) instead of paying asking price.
- Oregon's 9.5 percent rent cap limits how fast new owners can raise rents, making property condition and actual rent rolls critical to what deals close for.
- Only verified closed WVMLS sales show what buyers actually paid per door; asking prices and metro averages mask seller concessions, repair credits, and negotiated terms.
What Are Duplexes Actually Selling for in Salem and Keizer? Q1–Q3 2026 Market Analysis
One question that keeps coming up in my conversations with buyers and investors is this: What are duplexes and fourplexes actually selling for in Salem and Keizer this quarter?
Buyers want a number they can rely on before writing an offer, and owners want to know what their investment property might sell for. I understand why. Nobody wants to guess when making one of the biggest financial decisions of their life.
The honest answer is that there isn't one number that applies to every property. And if someone hands you a figure from Zillow, Redfin, or a rent-tracking website, they may be giving you an asking price or a metro-wide average dressed up as local market insight. That's not the same thing as what a duplex actually sold for.
To get a clearer picture, I analyzed 41 closed duplex sales identified in WVMLS data from the first three quarters of 2026. The results give us a useful look at sale prices, marketing times, financing, and seller concessions—and they reveal several important details that buyers and sellers should understand before entering the market.
What the actual duplex sales data tells us
Across the 41 closed duplex sales analyzed from Q1 through Q3 2026, the average original list price was $516,690, while the average sold price was $498,646. That's an average difference of approximately $18,045 between the original asking price and the final sale price.
On average, properties sold for approximately 96.5% of their original list price.
Here's the rest of the data:
- Closed sales analyzed: 41
- Average days on market: 104 days
- Average days on MLS: 89 days
- Average original list price: $516,690
- Average sold price: $498,646
- Average size: 2,179 square feet
- Average bedrooms: 4.5
- Average bathrooms: 3
These figures establish a useful baseline for evaluating duplexes. They don't mean every property is worth approximately $499,000, but they provide a starting point for a more informed conversation about pricing and market conditions.
Chart 1: Average original list price vs. average sold price
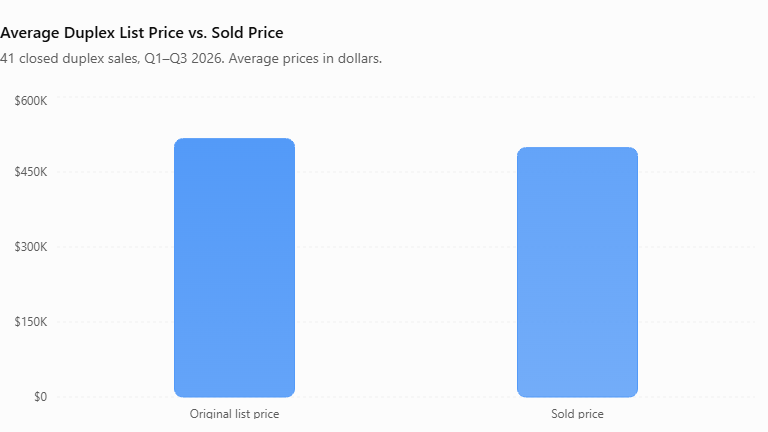
The gap between the two figures is worth paying attention to. Sellers may start with an ambitious asking price, but buyers ultimately determine what a property will sell for based on condition, rental income, financing costs, location, and the alternatives available to them.
For an investor, the difference between the original asking price and the final sale price can also affect the return on investment. Paying less than the original asking price doesn't automatically make a property a good deal, but it can create room in the numbers when the rental income and expenses support the purchase.
Why online estimates don't tell the whole story
Sites like Zillow, Redfin, and Homes.com can provide useful background information, but their listing prices aren't proof of what buyers actually paid. Their broader market statistics may also combine different property types and neighborhoods.
A property can sit on the market for months, undergo price reductions, and eventually close at a different price. Seller concessions can further affect the economics of the transaction by helping cover eligible buyer costs.
Rent-tracking websites have a similar limitation in reverse. Knowing the average rent for a two-bedroom apartment across Salem doesn't tell you what a particular duplex sold for, what its tenants currently pay, or how much income the property generates after expenses.
For investment property, I want to see verified closed sales, the actual property characteristics, and the financial details that influence the transaction.
That means comparing properties with similar unit counts, locations, conditions, layouts, and income potential—not simply choosing the closest asking price.
How long are duplexes taking to sell?
The dataset shows an average of 104 days on market and 89 days on MLS.
Those figures suggest buyers and sellers should prepare for a process that may take several months rather than assuming a property will sell immediately.
The distinction between the two measurements matters. Days on market and days on MLS can be calculated differently depending on the reporting system and listing history. For this analysis, I'm preserving the two averages as reported in the dataset rather than treating them as interchangeable.
Chart 2: Average marketing time
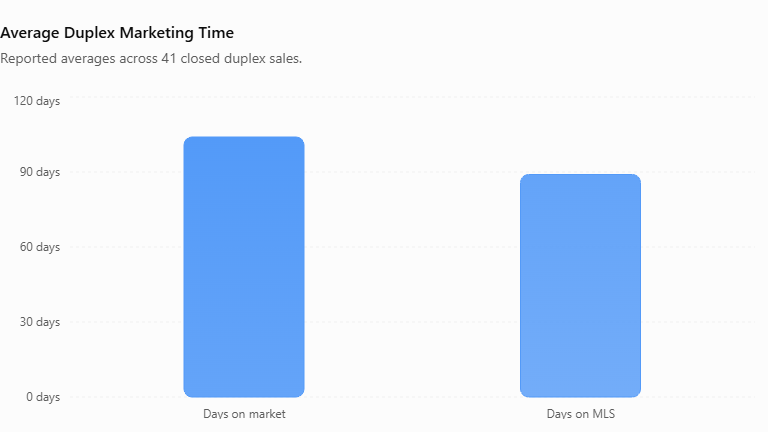
For sellers, this is a reminder to price realistically from the beginning and prepare for the possibility of negotiations. For buyers, it reinforces the importance of reviewing a property's listing history and understanding whether the seller has already adjusted the price or is likely to consider different terms.
A property that's been listed for an extended period isn't automatically a bargain. There may be a legitimate reason it hasn't sold, including deferred maintenance, an unrealistic asking price, below-market rental income, or financing complications.
The important question is why the property has remained available and whether that creates an opportunity for a buyer.
What financing types are buyers using?
Conventional financing was the most common method of purchasing the duplexes in this dataset, accounting for 22 of the 41 transactions, or 53.7%.
FHA financing accounted for another eight sales, while seven were cash purchases. The remaining transactions included first trust deed financing, VA financing, and other financing.
Here's the complete breakdown:
| Financing type | Sales | Share of sales |
|---|---|---|
| Conventional | 22 | 53.7% |
| FHA | 8 | 19.5% |
| Cash | 7 | 17.1% |
| First trust deed | 2 | 4.9% |
| VA | 1 | 2.4% |
| Other | 1 | 2.4% |
| Total | 41 | 100% |
Chart 3: Duplex sales by financing type
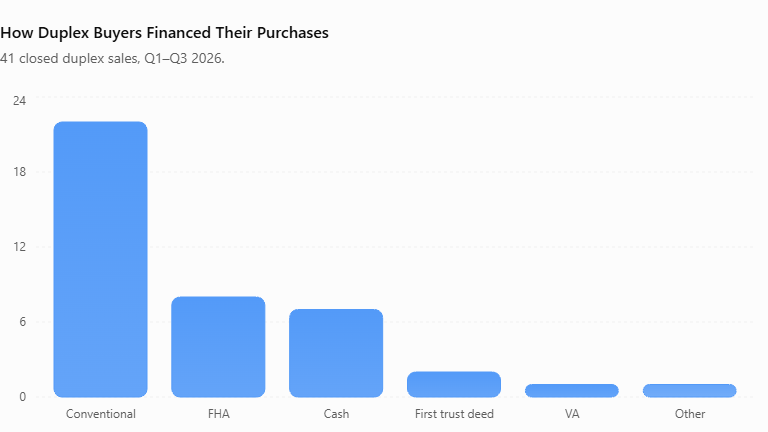
Conventional and FHA financing together accounted for 30 of the 41 sales, approximately 73% of the dataset. Cash purchases represented another 17.1%.
What does that mean for buyers and sellers?
Financing is an important part of getting a transaction to closing. Buyers need to understand their loan options, qualification requirements, down payment, and projected monthly costs. Sellers should evaluate the strength of an offer as a whole, including the buyer's financing, contingencies, proposed timeline, and ability to close.
A cash offer can provide advantages in some circumstances, but it isn't automatically the best offer. A well-qualified financed buyer may present attractive terms as well.
Seller concessions: An important part of the negotiation
One of the most interesting findings in this analysis is how frequently sellers contributed toward buyer costs.
Ten of the 41 closed sales—24.4%, or roughly one in four—included reported seller concessions.
The figures were:
- Average concession when one was reported: $11,265
- Average concession across all 41 sales: $2,748
- Reported concession range: $5,000 to $18,000
Seven conventional-financed transactions and three FHA-financed transactions included concessions. No concessions were reported for the cash, VA, first trust deed, or other financing categories in this dataset.
Chart 4: Seller concessions in the duplex market
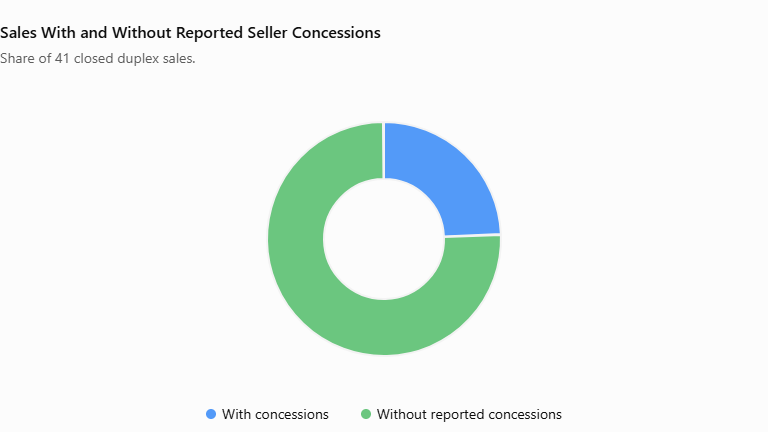
The fact that approximately one in four sellers provided concessions is worth noting. It demonstrates that the negotiated economics of a sale can extend beyond the purchase price.
For example, a seller concession may help cover eligible closing costs or other permitted expenses, subject to the buyer's loan program and lender requirements. This can reduce the buyer's immediate cash burden without requiring the seller to make an equivalent reduction in the headline sale price.
For sellers, concessions can sometimes help preserve the agreed purchase price while addressing a buyer's financing needs. For buyers, they can be a useful negotiation tool when structured appropriately.
However, concessions aren't free money. Their value depends on the terms of the transaction, lender restrictions, and what the buyer would otherwise have paid. The dataset also doesn't establish whether concessions were responsible for a faster sale or a higher final price.
What should investors pay per door?
Price per door is one of the simplest metrics investors use to compare multifamily properties. Take the sale price and divide it by the number of units.
For example, if a two-unit property sells for $500,000, the price is $250,000 per unit.
That calculation is useful, but it shouldn't be the primary number driving an investment decision, as each duplex isn't an apples to apples comparison.
Two duplexes can sell at the same price per unit and have very different financial outcomes. One might have stable tenants paying market rents, updated systems, and minimal near-term maintenance. Another might need significant repairs, have below-market rents, or carry operating expenses that reduce cash flow.
I would compare price per door alongside:
- Current rental income and realistic market rents.
- Property taxes, insurance, maintenance, utilities, and management expenses.
- Deferred maintenance and anticipated capital improvements.
- Vacancy assumptions and potential tenant turnover.
- Financing costs and the cash required to close.
- The property's condition, location, and long-term appreciation potential.
The 41-sale summary provides average sale prices and property characteristics, but it doesn't include enough individual transaction detail to calculate a reliable average price per door or establish a specific price-per-door benchmark for every property type.
For a specific purchase or sale, the next step is to pull comparable closed transactions and examine the individual properties rather than relying solely on an overall average.
If you're shopping for your first duplex, I've also laid out the process in my step-by-step guide for duplex buyers.
What these numbers mean if you're buying or selling
If you're a buyer, don't assume the original asking price is where the deal will land. The dataset shows an average difference of approximately $18,045 between original list price and sold price, but that is an average across 41 properties—not a guarantee that you can negotiate the same reduction on the property you're considering.
Start with comparable closed sales. Evaluate the rental income, estimate your expenses, and determine what the property can support financially. Then consider whether negotiating the purchase price, requesting eligible concessions, or adjusting other terms would best serve your goals.
If you're a seller, the results provide a useful reference point for pricing and negotiations. The average sale price was below the average original list price, and about one in four transactions included reported concessions. That doesn't mean you should automatically discount your property or offer concessions. It means you should understand the competition, prepare for negotiation, and evaluate the entire offer rather than focusing exclusively on the initial price.
Condition matters, too. A well-maintained duplex with realistic rents may appeal to a different group of buyers than a property requiring substantial work. A strong marketing strategy should explain both the property's income potential and the costs or improvements a buyer may need to consider.
Questions people ask
How do you find the market rent for a specific property?
I start with comparable units in the same submarket and look at their current rental rates, condition, parking, layout, and amenities. Then I compare those figures with the property's existing rent roll and consider whether any units could realistically command different rents when legally permitted.
For occupied properties, Oregon's applicable rent regulations and the terms of existing tenancies also need to be considered. A projected market rent isn't necessarily the amount a new owner can immediately collect.
Are you able to help me find off-market deals?
Sometimes. Off-market opportunities often come through relationships with owners, investors, and other professionals rather than through a public listing database.
I can't promise that an off-market duplex will be available when you're ready to buy, but maintaining relationships with people who regularly work in small multifamily real estate can help you hear about potential opportunities before they reach the open market.
What are the benefits of buying multifamily investment property?
I generally focus on five potential benefits, in no particular order:
- Monthly cash flow from rental income.
- Long-term appreciation in property value.
- Equity growth as mortgage principal is paid down.
- Potential tax advantages, depending on the investor's circumstances.
- Building wealth while diversifying investments.
None of these benefits is guaranteed. Actual results depend on the purchase price, financing, operating expenses, vacancy, maintenance, taxes, market conditions, and how well the property is managed.
The bottom line on Salem and Keizer duplex sales
The first three quarters of 2026 provide a useful snapshot of the 41 closed duplex sales analyzed in WVMLS data. The average sold price was $498,646, properties averaged 104 days on market, conventional financing accounted for 53.7% of sales, and approximately one in four transactions included reported seller concessions.
These figures are useful starting points, not a substitute for property-specific analysis. They describe this duplex dataset and should not automatically be applied to triplexes, fourplexes, or every neighborhood in Salem and Keizer.
If you're considering buying or selling a duplex, triplex, or fourplex, I can help you look beyond the asking price and evaluate the comparable sales, rental income, financing, and terms that actually influence the deal.
Reach out, and let's run the numbers on the specific property you're considering before you make your next move.

Jordan Sparks
Principal Broker, Sparks Property Group at SMI Real Estate. Specializing in Multifamily and Investment property in Salem, Keizer, and the Willamette Valley. Licensed in Oregon, #200610098.
jordan@smire.com · 541.646.0650
Connect with Sparks Property Group ↗




Member discussion